Fig. 1
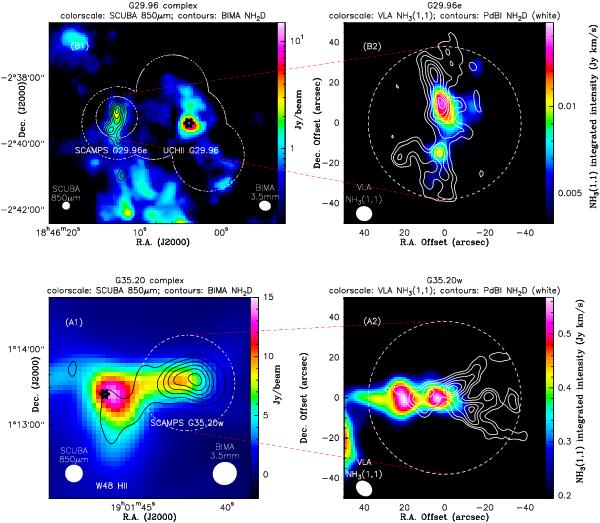
Overview of the SCAMPS regions, G29.96e (top) and G35.20w (bottom). Panel A1) SCUBA 850 μm dust continuum (color scale) and BIMA NH2D at 85.9 GHz (contours). Panel A2) VLA NH3 (1, 1) (color scale) starting at 3σ and PdB NH2D at 85.9 GHz (white contours). Panel B1) SCUBA 850 μm dust continuum (color scale) and BIMA NH2D at 85.9 GHz (contours). The white dash circle indicates the BIMA coverage. Panel B2) VLA NH3 (1, 1) integrated intensity (color scale) starting at 3σ and PdB NH2D at 85.9 GHz integrated intensity (white contours). The contour levels for PdBI maps start at −3σ, 3σ in steps of 3σ. The primary beam at 3.5 mm is indicated by white dashed circles in the right panels. The nominal positions of the Hii regions are marked as stars (Wood & Churchwell 1989).
Current usage metrics show cumulative count of Article Views (full-text article views including HTML views, PDF and ePub downloads, according to the available data) and Abstracts Views on Vision4Press platform.
Data correspond to usage on the plateform after 2015. The current usage metrics is available 48-96 hours after online publication and is updated daily on week days.
Initial download of the metrics may take a while.