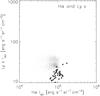
Fig. 8
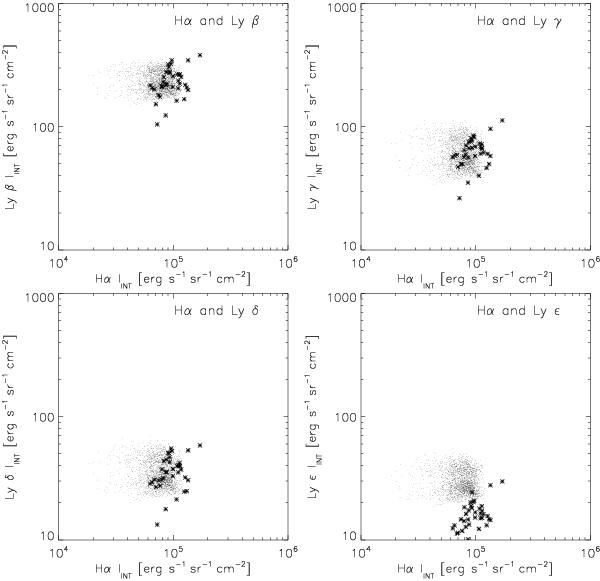
Correlation plots between the integrated intensities of the Hα and Lyβ, Lyγ, Lyδ and Lyϵ lines. The stars represent the Hα Meudon/MSDP and SoHO/SUMER observational points between 10″ and 46″ along the SoHO/SUMER slit (12:47 UT for MSDP and 13:04 UT for SoHO/SUMER). Dots correspond to the theoretical two-dimensional model. In each panel there are 8300 theoretical points, 83 different line-of-sights for 100 different stochastic realizations for 40-threads system.
Current usage metrics show cumulative count of Article Views (full-text article views including HTML views, PDF and ePub downloads, according to the available data) and Abstracts Views on Vision4Press platform.
Data correspond to usage on the plateform after 2015. The current usage metrics is available 48-96 hours after online publication and is updated daily on week days.
Initial download of the metrics may take a while.