Fig. 6
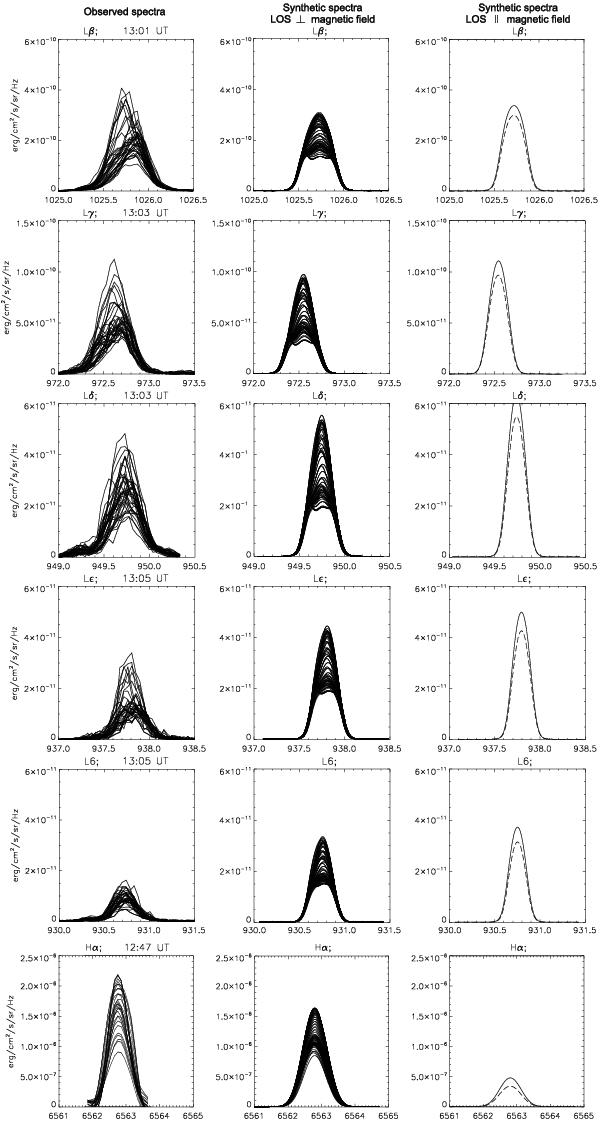
Comparison between the observed Lyman lines and the Hα line, and the synthetic Lyman lines and the Hα line of the Model2. The left column displays the observed line profiles. The middle column shows the synthetic line profiles of the multi-thread Model2 with 40 threads obtained with the LOS perpendicular to the magnetic field. We display profiles emerging from 83 positions along the foremost thread of the multi-thread model. The right column displays the synthetic line profiles of the single-thread Model2 obtained with the LOS parallel to the magnetic field. We show the profiles in the middle of the thread (solid lines) and at one quarter distance from the thread boundary (dashed lines).
Current usage metrics show cumulative count of Article Views (full-text article views including HTML views, PDF and ePub downloads, according to the available data) and Abstracts Views on Vision4Press platform.
Data correspond to usage on the plateform after 2015. The current usage metrics is available 48-96 hours after online publication and is updated daily on week days.
Initial download of the metrics may take a while.