Fig. 5
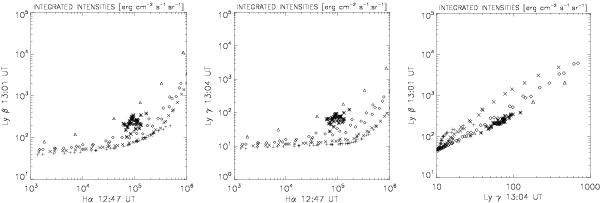
Correlation plots between the integrated intensities of the Hα, Lyβ and Lyγ lines. The stars represent Hα Meudon/MSDP and SoHO/SUMER observational points between 10″ and 46″ along the SoHO/SUMER slit (see Fig. 2). Other symbols correspond to the theoretical one-dimensional (1D) models at different temperatures (Gouttebroze et al. 1993): +: T = 6000 K, × : T = 8000 K, ◇: T = 10 000 K, △ : T = 15 000 K.
Current usage metrics show cumulative count of Article Views (full-text article views including HTML views, PDF and ePub downloads, according to the available data) and Abstracts Views on Vision4Press platform.
Data correspond to usage on the plateform after 2015. The current usage metrics is available 48-96 hours after online publication and is updated daily on week days.
Initial download of the metrics may take a while.