Free Access
Fig. 3
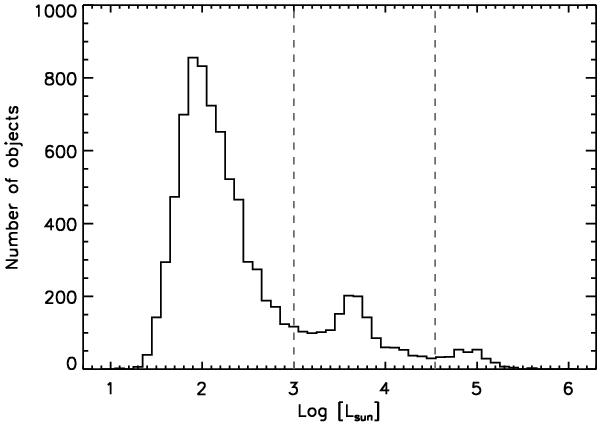
Histogram of the integrated luminosities based on black-body fittings of all objects in our sample before the luminosity-cut. The dashed grey lines indicate a lower and upper limit for the luminosity of post-AGB stars and are located at 1000 and 35 000 L⊙ respectively.
Current usage metrics show cumulative count of Article Views (full-text article views including HTML views, PDF and ePub downloads, according to the available data) and Abstracts Views on Vision4Press platform.
Data correspond to usage on the plateform after 2015. The current usage metrics is available 48-96 hours after online publication and is updated daily on week days.
Initial download of the metrics may take a while.