Fig. C.1
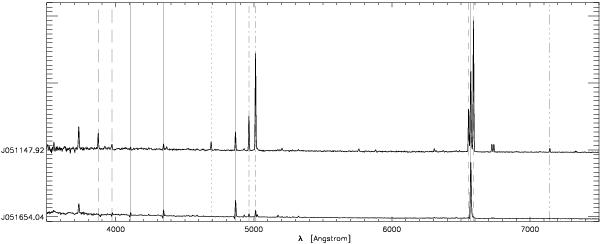
Spectra of the two PN-like objects – J051654.04-672005.1 and J051147.92-692342.3 – that occur in our sample. All spectra were normalised and displaced vertically by 15 units to increase the visibility of the plot. The vertical grey lines indicate the wavelengths at which spectral features of certain elements are expected, corrected for the average radial velocity of the LMC. These are: Balmer lines (solid), [O iii] (dash dotted), [N ii] (dashed), He ii (dotted), [Ar iii] (dash dot dotted) and [Ne iii] (long dashes).
Current usage metrics show cumulative count of Article Views (full-text article views including HTML views, PDF and ePub downloads, according to the available data) and Abstracts Views on Vision4Press platform.
Data correspond to usage on the plateform after 2015. The current usage metrics is available 48-96 hours after online publication and is updated daily on week days.
Initial download of the metrics may take a while.