Fig. 21
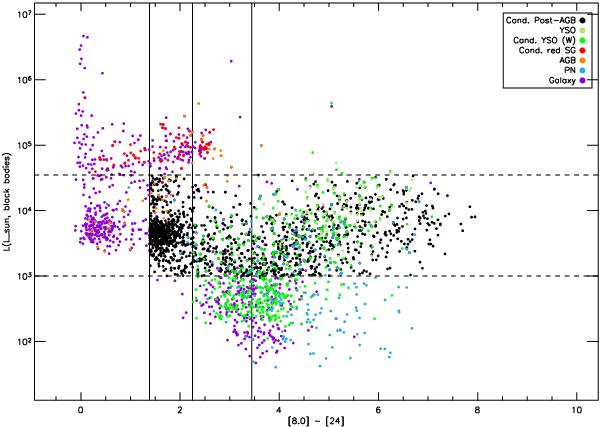
Plot of the estimated luminosities from Sect. 2.3 versus the [8] − [24] colour. The displayed objects are the same as in Fig. 20. The vertical lines are the boundaries of the different subtypes of our post-AGB sample based on the shape of the SED, where the objects with a disc can be found between the two outer lines and those with a shell are to the right of the middle one. The dashed horizontal lines indicate the luminosity-cut we used.
Current usage metrics show cumulative count of Article Views (full-text article views including HTML views, PDF and ePub downloads, according to the available data) and Abstracts Views on Vision4Press platform.
Data correspond to usage on the plateform after 2015. The current usage metrics is available 48-96 hours after online publication and is updated daily on week days.
Initial download of the metrics may take a while.