Fig. 20
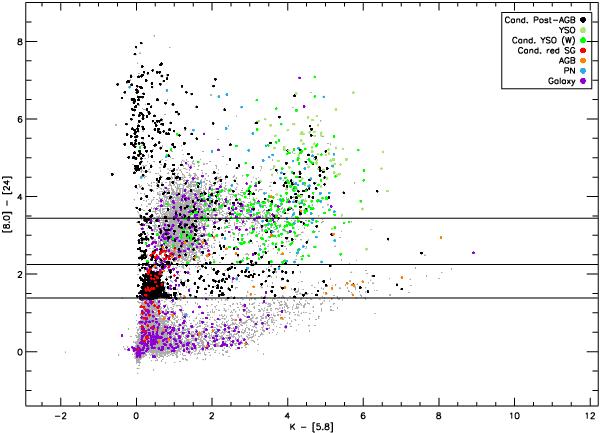
Colour–colour plot of K − [5.8] vs. [8] − [24] . The displayed objects are the final sample of post-AGB candidates (black dots) together with the YSOs from Seale et al. (2009) (khaki dots), the high-probability candidate YSOs from Whitney et al. (2008) (green dots), the red supergiants from Oestreicher et al. (1997) (red dots), the AGB stars from Trams et al. (1999) (orange dots), the PNe from Reid & Parker (2006) (blue dots) and all galaxies from NED that are in the line of sight of the LMC (purple dots). The grey dots in the background represent the initial SAGE catalogue and the black horizontal lines the boundaries of the different subtypes of our post-AGB sample based on the shape of the SED. Objects with an SED that is indicative of a disc can be found between the bottom and the top line, while those with a shell are above the one in the middle. The bottom line also indicates the colour-cut we used.
Current usage metrics show cumulative count of Article Views (full-text article views including HTML views, PDF and ePub downloads, according to the available data) and Abstracts Views on Vision4Press platform.
Data correspond to usage on the plateform after 2015. The current usage metrics is available 48-96 hours after online publication and is updated daily on week days.
Initial download of the metrics may take a while.