Fig. 2
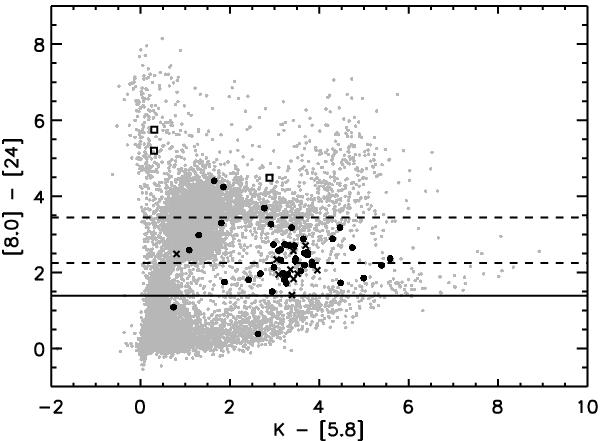
Colour–colour plot of K − [5.8] versus [8] − [24] . The small grey dots in the background are the sources of the SAGE catalogue, the black crosses represent the 11 RV Tauri stars in the LMC from the OGLE-III catalogue (Soszyński et al. 2008) that are detected at 8 and 24 μm and the black dots and squares are the Galactic disc sources from De Ruyter et al. (2006) and some Galactic shell sources observed with the IR spectrometer SWS onboard ISO transformed onto the Spitzer filters. The black solid line indicates the colour-cut we are using to select likely post-AGB candidates, the lower dashed line indicates the lower limit for post-AGB candidates with a shell and the upper dashed line the upper limit for post-AGB candidates with a disc (see Sect. 2.5).
Current usage metrics show cumulative count of Article Views (full-text article views including HTML views, PDF and ePub downloads, according to the available data) and Abstracts Views on Vision4Press platform.
Data correspond to usage on the plateform after 2015. The current usage metrics is available 48-96 hours after online publication and is updated daily on week days.
Initial download of the metrics may take a while.