Fig. 16
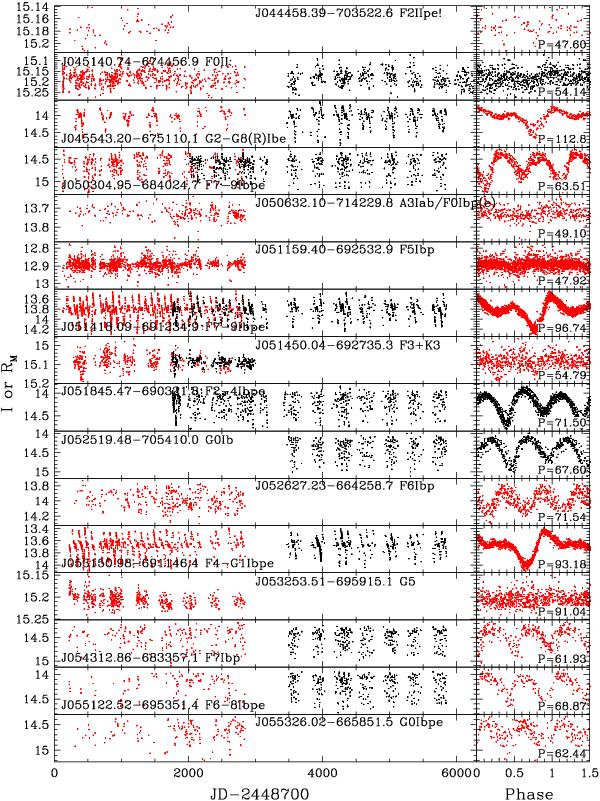
Raw and phased light curves of post-AGB candidates that are Population II Cepheids. Light curves coloured red are MACHO red magnitudes from the MACHO database, while the black curves are I magnitudes from OGLE II and/or OGLE III. When light curves are available from both MACHO and OGLE, the MACHO red magnitude has been shifted so that its mean agrees with that of OGLE I. The phased light curves were made from one source only, as indicated by the colour. The name of each object is listed in the figure along with the spectral type and the period, assumed to be the time between deep minima (or two cycles of the light curve where the minima are of equal depth).
Current usage metrics show cumulative count of Article Views (full-text article views including HTML views, PDF and ePub downloads, according to the available data) and Abstracts Views on Vision4Press platform.
Data correspond to usage on the plateform after 2015. The current usage metrics is available 48-96 hours after online publication and is updated daily on week days.
Initial download of the metrics may take a while.