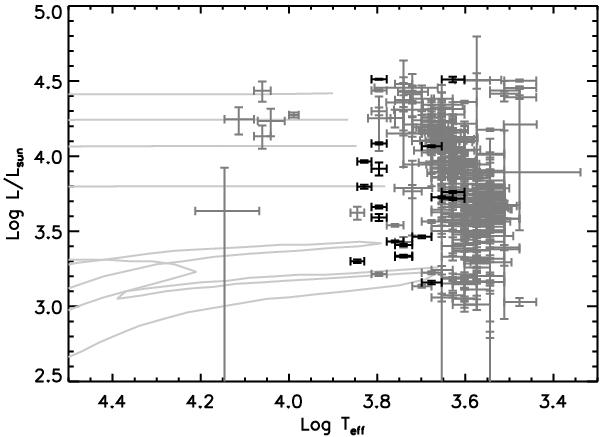
Fig. 13

HR diagram containing all post-AGB candidates with an SED indicative of a disc of which the final luminosities were computed using the SED (Sect. 4.1). The evolutionary tracks are from Blöcker (1995) and correspond to stars with, from bottom to top, an initial mass of 1, 3, 4, 5 and 7 M⊙. The 1 M⊙ model suffers two late thermal pulses. Note that the objects shown here are a subset of the entire sample of disc sources as the objects for which the final luminosity was computed with the BB fit (Sect. 2.3) lack an effective temperature estimate and are hence missing in this plot.
Current usage metrics show cumulative count of Article Views (full-text article views including HTML views, PDF and ePub downloads, according to the available data) and Abstracts Views on Vision4Press platform.
Data correspond to usage on the plateform after 2015. The current usage metrics is available 48-96 hours after online publication and is updated daily on week days.
Initial download of the metrics may take a while.


