Free Access
Fig. 10
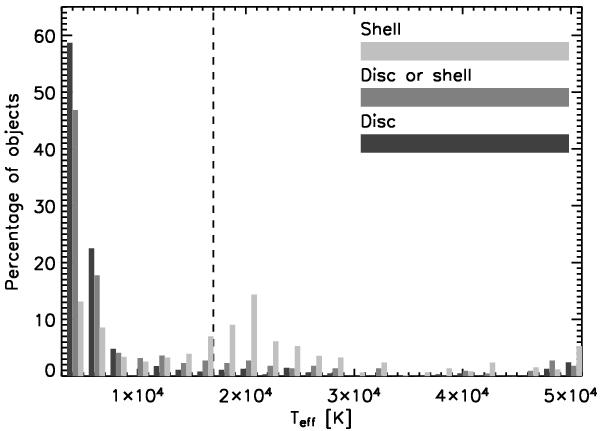
Histogram of the effective temperatures of the different types of objects based on SED fitting (see Sect. 4.1). The dashed line at 17 000 K indicates the upper temperature limit imposed by us (see text).
Current usage metrics show cumulative count of Article Views (full-text article views including HTML views, PDF and ePub downloads, according to the available data) and Abstracts Views on Vision4Press platform.
Data correspond to usage on the plateform after 2015. The current usage metrics is available 48-96 hours after online publication and is updated daily on week days.
Initial download of the metrics may take a while.