Free Access
Fig. 4
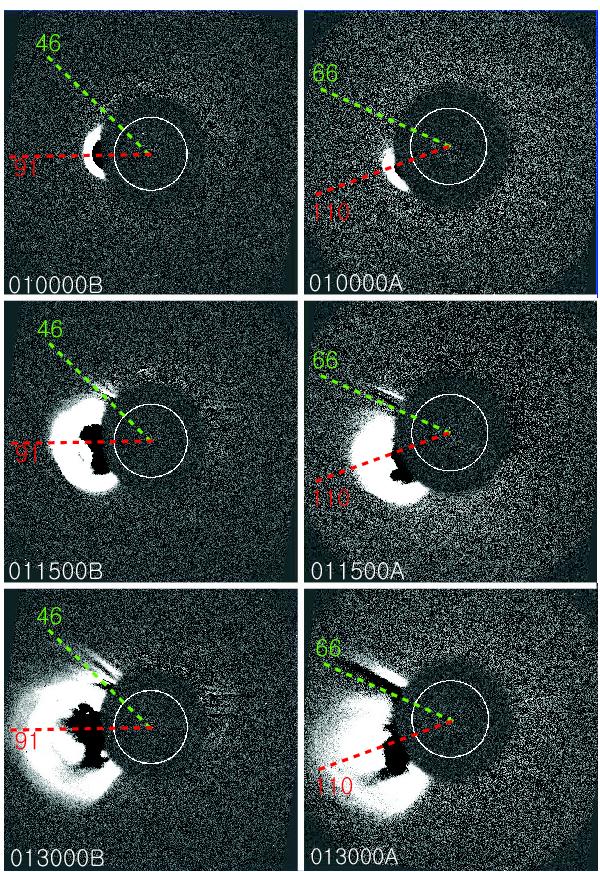
Pre-event subtracted images of the expanding CME and nearby streamer between 01:00 and 01:30 UT seen from COR1 instruments onboard STEREO B (left) and STEREO A (right) satellites. Red and green dotted lines and numbers denote the position angles of the CME nose and the streamer.
Current usage metrics show cumulative count of Article Views (full-text article views including HTML views, PDF and ePub downloads, according to the available data) and Abstracts Views on Vision4Press platform.
Data correspond to usage on the plateform after 2015. The current usage metrics is available 48-96 hours after online publication and is updated daily on week days.
Initial download of the metrics may take a while.