Fig. 8
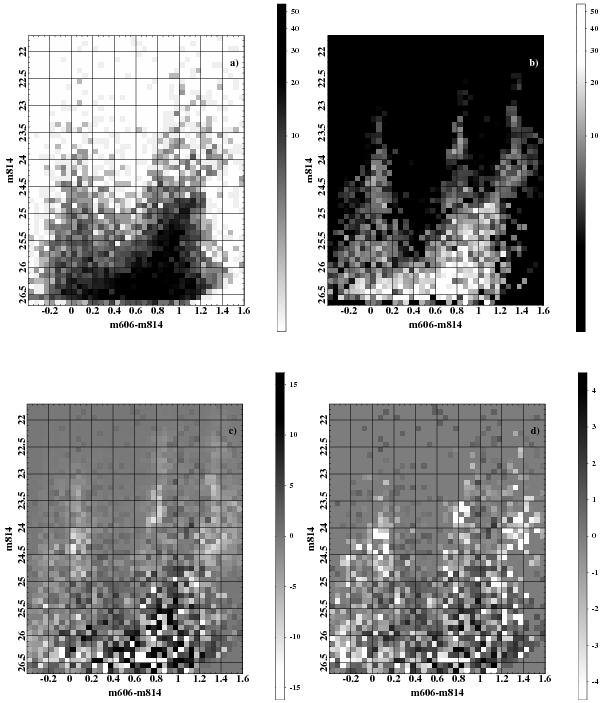
Hess diagrams (displayed using ACS filters) for ESO318-20. The density values are listed along the colorbars. Panel a) Data; the reported densities are in units of number of stars per bin (with a binsize of 0.05 mag in color times 0.10 mag in magnitude). Panel b) Best-fit synthetic model, with a reverse color scale with respect to the data to facilitate comparison; units are number of stars per bin. Panel c) Difference between data and best-fit model; units are number of stars per bin. Panel d) Difference between data and best-fit model, weighted by the Poisson errors; units are proportional to the square root of the number of stars per bin.

Current usage metrics show cumulative count of Article Views (full-text article views including HTML views, PDF and ePub downloads, according to the available data) and Abstracts Views on Vision4Press platform.
Data correspond to usage on the plateform after 2015. The current usage metrics is available 48-96 hours after online publication and is updated daily on week days.
Initial download of the metrics may take a while.