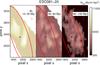
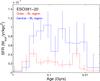
Fig. 11

Upper panel. Spatially resolved star formation history for the central region of ESO381-20, as from BL stars of different ages (as indicated in the subpanels). The SFR per unit area is indicated on the colorbar, with the same color scale for all of the subsamples. The angular resolution of the maps is marked with a red rectangle in each subpanel. The center of the galaxy is indicated by a black cross. Just as a reference among different frames, we also overplot in red the ellipse corresponding to the projected major axis radius at the isophote level 25 mag arcsec-1 in the I-band (taken from Sharina et al. 2008). Lower panel. Spatially resolved star formation history (via synthetic CMD modeling) of ESO381-20 within the last 1 Gyr. We select two subsamples of stars, found in the “inner” and in the “outer” regions of the galaxy, by looking at the density maps of the BL stars (Fig. 10, see text for details). The star formation rate for each region (normalized to the area of the considered region) as a function of time is plotted, with the oldest age being on the left side and the present day on the right edge of the (logarithmic) horizontal axis.
Current usage metrics show cumulative count of Article Views (full-text article views including HTML views, PDF and ePub downloads, according to the available data) and Abstracts Views on Vision4Press platform.
Data correspond to usage on the plateform after 2015. The current usage metrics is available 48-96 hours after online publication and is updated daily on week days.
Initial download of the metrics may take a while.