Fig. 10
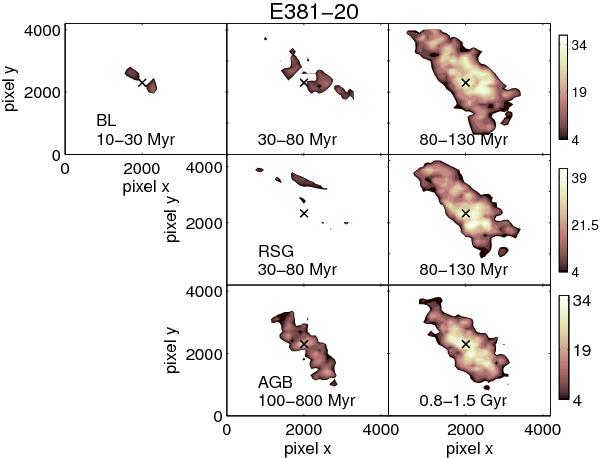
Density maps for one of the target galaxies (ESO381-20), divided into different evolutionary stages. These are: in the top row BL stars; in the middle row RSG stars; in the bottom row luminous AGB stars. For each panel in each row, there is an age range as indicated. The color scale is the same within each row, normalized to the peak density of the densest (=oldest) subsample, and the stellar density values are listed along the colorbars (in units of number of stars per 0.1 kpc2). For each map there are 10 equally spaced isodensity contours, starting at the 1σ significance level up to the peak significance level. The peak levels are (from the youngest to the oldest sample): BL = 1.6σ,1.6σ,3.2σ, RSG = 1.3σ,3.2σ, AGB = 2.3σ,3.1σ. The center of the galaxy is indicated with a black cross.
Current usage metrics show cumulative count of Article Views (full-text article views including HTML views, PDF and ePub downloads, according to the available data) and Abstracts Views on Vision4Press platform.
Data correspond to usage on the plateform after 2015. The current usage metrics is available 48-96 hours after online publication and is updated daily on week days.
Initial download of the metrics may take a while.