Free Access
Fig. 8
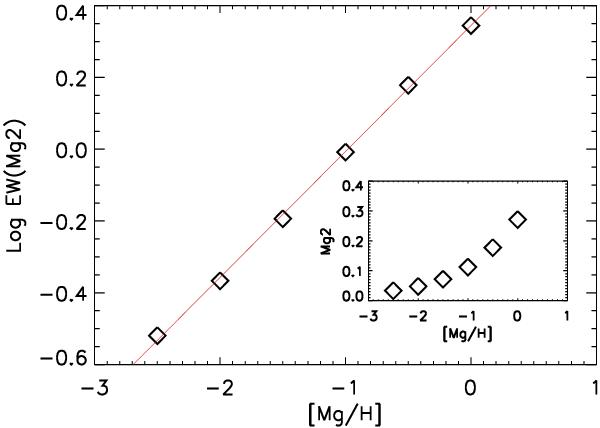
Curve-of-growth-like diagram for the EW(Mg2) as modelled by the solar-scaled spectra of a K0 giant star. The solid line is the formal linear regression. The inset shows the Mg2 index as a function of the Mg abundance.
Current usage metrics show cumulative count of Article Views (full-text article views including HTML views, PDF and ePub downloads, according to the available data) and Abstracts Views on Vision4Press platform.
Data correspond to usage on the plateform after 2015. The current usage metrics is available 48-96 hours after online publication and is updated daily on week days.
Initial download of the metrics may take a while.