Fig. 8
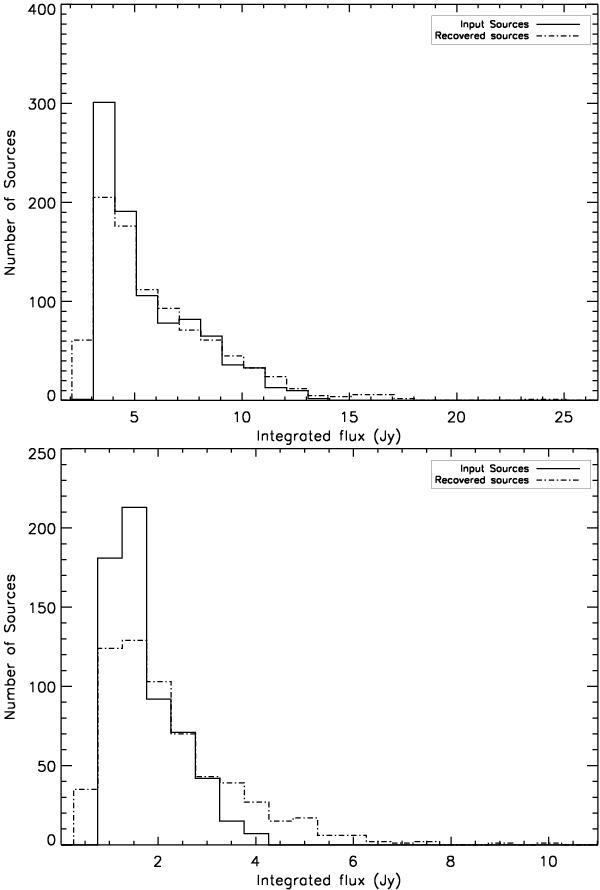
Histograms for the distributions of integrated fluxes for the sources that were positively recovered in the simulations for Fpeak = 0.3 Jy/pxl sources (top panel) and for the Fpeak = 0.1 Jy/pxl sources (bottom panel). In each figure the full line represent the distribution of input fluxes, while the dot-dashed line is the distribution of recovered fluxes. The results reported are those for a curvature threshold of 0.5σ∂2.
Current usage metrics show cumulative count of Article Views (full-text article views including HTML views, PDF and ePub downloads, according to the available data) and Abstracts Views on Vision4Press platform.
Data correspond to usage on the plateform after 2015. The current usage metrics is available 48-96 hours after online publication and is updated daily on week days.
Initial download of the metrics may take a while.