Fig. 10
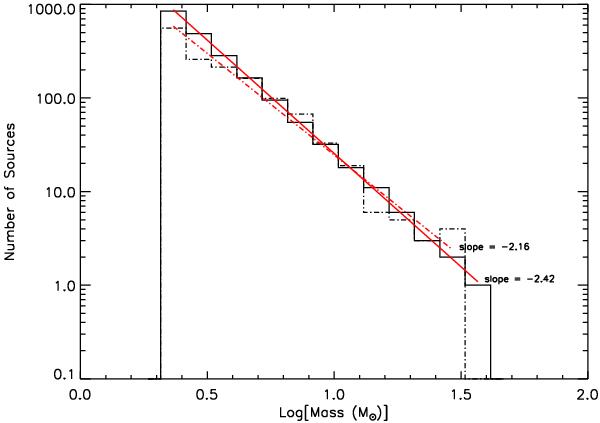
Mass functions for a simulation of 2000 sources with mass extracted from a Salpeter IMF (full black line). The full red line is a linear fit to the simulated mass function, where the slope is −2.42 ± 0.02. The dash-dotted line is the mass distribution of the sources extracted form the simulated field. The red dash-dotted line is the linear fit to the distribution; the recovered mass function slope is 2.2 ± 0.1, and it agrees with the input one within a 2σ uncertainty.
Current usage metrics show cumulative count of Article Views (full-text article views including HTML views, PDF and ePub downloads, according to the available data) and Abstracts Views on Vision4Press platform.
Data correspond to usage on the plateform after 2015. The current usage metrics is available 48-96 hours after online publication and is updated daily on week days.
Initial download of the metrics may take a while.