Fig. 4
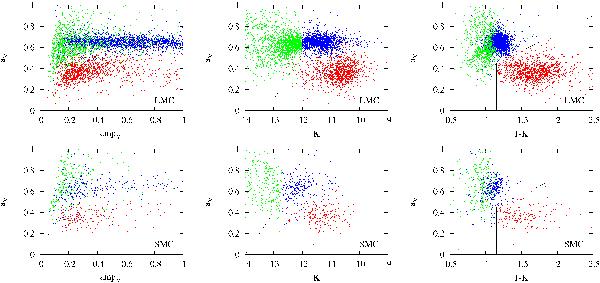
Plots depicting three methods of distinguishing O- and C-rich variable stars (from left to right): slope-colour amplitude aV(ampVI), slope-K magnitude aV(K) and slope-J − K colour aV(J − K), for EROS LMC (top) and SMC (bottom) data. Vertical lines indicate adopted TRGB dividing RGB and AGB stars. See text for a detailed description of the methods and parameters of the boundaries. Black, dark grey, and light grey dots (blue, red, and green in electronic edition) respectively mark O- and C-rich AGB stars and O-rich RGB ones, classified using K magnitudes for AGB/RGB and leftmost panels for O/C content.
Current usage metrics show cumulative count of Article Views (full-text article views including HTML views, PDF and ePub downloads, according to the available data) and Abstracts Views on Vision4Press platform.
Data correspond to usage on the plateform after 2015. The current usage metrics is available 48-96 hours after online publication and is updated daily on week days.
Initial download of the metrics may take a while.