Fig. 3
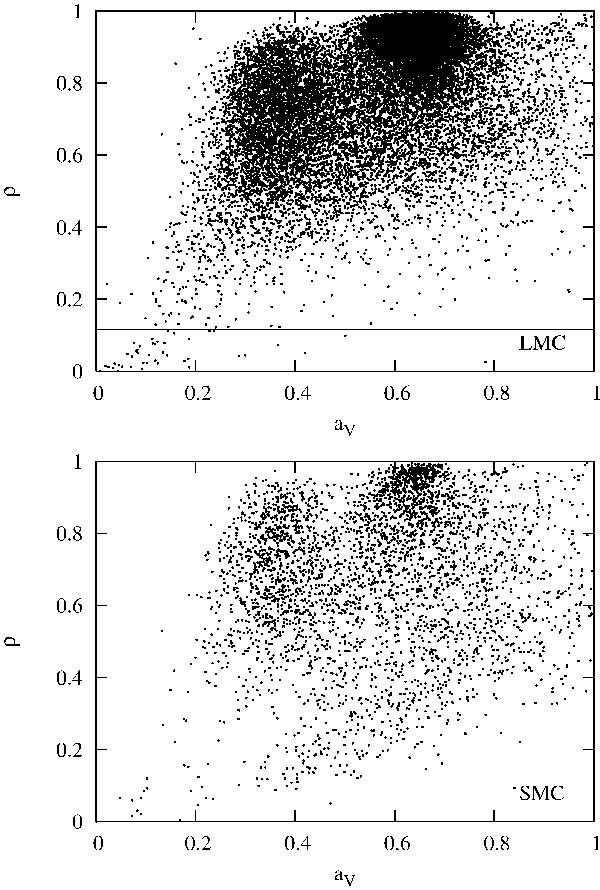
Plot of the colour–magnitude correlation coefficient against the slope of magnitude-colour relation, for EROS LMC and SMC data. The correlation coefficient serves as a measure of quality of the slope av. The horizontal lines correspond to probability 0.995 of the null hypothesis H0, i.e. points lying above correspond to statistically significant correlation.
Current usage metrics show cumulative count of Article Views (full-text article views including HTML views, PDF and ePub downloads, according to the available data) and Abstracts Views on Vision4Press platform.
Data correspond to usage on the plateform after 2015. The current usage metrics is available 48-96 hours after online publication and is updated daily on week days.
Initial download of the metrics may take a while.