Free Access
Fig. 2
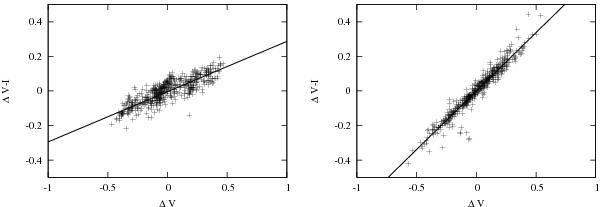
Sample plot of raw colour and magnitude variations for the same 2 stars as in Fig. 1. We also plot the regression lines. Their inclination parameter is aV, discussed in the text.
Current usage metrics show cumulative count of Article Views (full-text article views including HTML views, PDF and ePub downloads, according to the available data) and Abstracts Views on Vision4Press platform.
Data correspond to usage on the plateform after 2015. The current usage metrics is available 48-96 hours after online publication and is updated daily on week days.
Initial download of the metrics may take a while.