Fig. 3
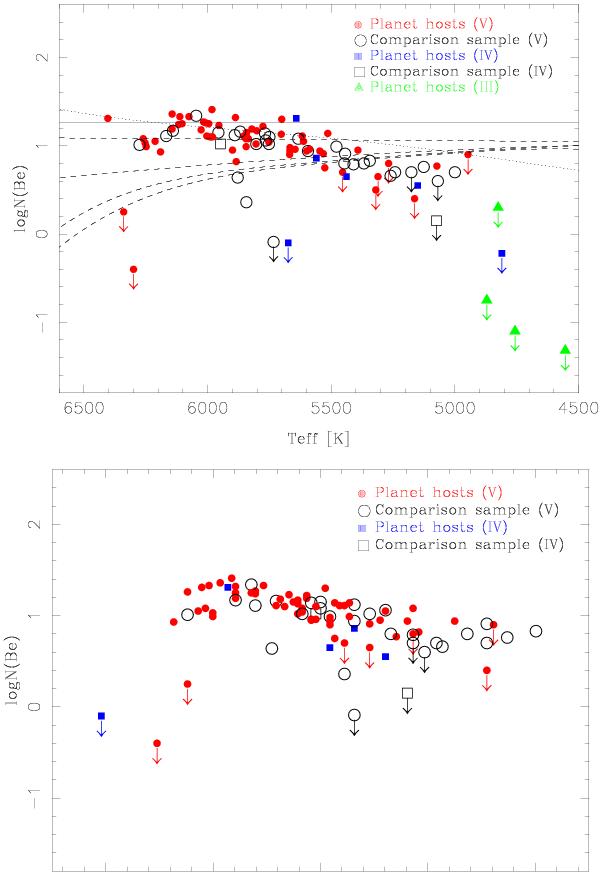
Be abundances as a function of effective temperature (top panel) and as a function of mass (bottom panel) for the planet-host stars in our sample plus the stars from García López & Pérez de Taoro (1998); Santos et al. (2002, 2004b,c). Filled and open symbols represent stars with and without planets. Circles, squares, and triangles are depicted for dwarfs (luminosity class V), subgiants (IV) and giants (III). In the top panel we superimpose the Be depletion isochrones (case A) of Pinsonneault et al. (1990) for solar metallicity and an age of 1.7 Gyr. From top to bottom, the lines represent a standard model (solid line) and four models (dashed lines) with different initial angular momentum. We also depict the Be depletion model (dotted line) including gravity waves provided in Montalbán & Schatzman (2000).
Current usage metrics show cumulative count of Article Views (full-text article views including HTML views, PDF and ePub downloads, according to the available data) and Abstracts Views on Vision4Press platform.
Data correspond to usage on the plateform after 2015. The current usage metrics is available 48-96 hours after online publication and is updated daily on week days.
Initial download of the metrics may take a while.