Fig. 2
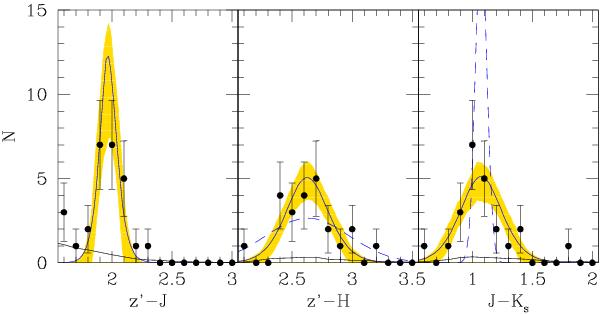
colour distribution of galaxies in the JKCS 041 direction (points) and in a control region all around the cluster, normalized to the cluster solid angle (lower, black, curve). The (blue) curve with shaded 68% (highest posterior credible) intervals is a Gaussian fit to the data. Approximated (i.e.  ) error bars are shown for display purpose only. The dashed blue Gaussian lines show the colour spread expected for a 250 Myr (central panel) or 50 Myr (right panel) age spread.
Current usage metrics show cumulative count of Article Views (full-text article views including HTML views, PDF and ePub downloads, according to the available data) and Abstracts Views on Vision4Press platform.
Data correspond to usage on the plateform after 2015. The current usage metrics is available 48-96 hours after online publication and is updated daily on week days.
Initial download of the metrics may take a while.