| Issue |
A&A
Volume 529, May 2011
|
|
|---|---|---|
| Article Number | A99 | |
| Number of page(s) | 3 | |
| Section | Extragalactic astronomy | |
| DOI | https://doi.org/10.1051/0004-6361/201116786 | |
| Published online | 11 April 2011 | |
Research Note
When two become one: an apparent QSO pair turns out to be a single quasar
1
INAF - Osservatorio Astronomico di Trieste, via Tiepolo 11, 34131 Trieste, Italy
e-mail: This email address is being protected from spambots. You need JavaScript enabled to view it.
2
Dark Cosmology Centre, Niels Bohr Institute, University of Copenhagen, Juliane Maries Vej 30, 2100 Copenhagen Ø, Denmark
Received: 25 February 2011
Accepted: 10 March 2011
Abstract
We report on our serendipitous discovery that the objects Q 01323-4037 and Q 0132-4037, listed in the Véron-Cetty & Véron catalog (2006, A&A, 455, 773) as two different quasars, are actually a quasar and a star. We briefly discuss the origin of the misidentification, and provide a refined measurement of the quasar redshift.
Key words: quasars: individual: Q 01323-4037 / quasars: individual: Q 0132-4037
© ESO, 2011
1. Introduction
Q 01323-4037 and Q 0132-4037 are listed as two separate quasi-stellar objects (QSOs) in the last editions of the catalogue of quasars and active nuclei (Véron-Cetty & Véron 2003, 2006, 2010). According to this catalog, the two objects (A and B for simplicity) have similar redshift, zA = 2.100, zB = 2.150. Their angular separation in the sky, as computed from the J2000 coordinates (αA = 01 34 32.5, δA = −40 22 08 and αB = 01 34 32.2, δB = −40 21 33, respectively), is approximately 35 arcsec, making the seeming QSO pair a suitable candidate for a tomographic study of the inter-galactic medium along close lines of sight.
We observed the two objects in November, 2010 with the single target, medium resolution spectrograph X-shooter (D’Odorico et al. 2006) at the Very Large Telescope (VLT), in the context of a GTO program. Figure 1 reproduces the finding chart used for our observation, with the position of A and B according to Véron-Cetty & Véron (2010). We extracted the 1D spectra of the objects for the three X-shooter arms (UVB, VIS, and NIR) using the release 1.2.0 of the X-shooter reduction pipeline (Goldoni et al. 2006) and the ESO-MIDAS package. Figure 2 shows the spectra obtained after flat-field correction, bias and sky subtraction, and flux calibration. Much to our surprise, the observation revealed that B is not a QSO, unlike A, which displays a typical QSO spectrum with a strong Lyman α emission at λ ≃ 3820 Å. Apparently, a spurious object has been included in the Véron-Cetty & Véron catalog by mistake.
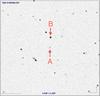 |
Fig. 1 Finding chart with the position of object A (a QSO) and object B (a star mistakenly identified as a separate QSO). The image is centered on object A (J2000 coordinates αA = 01 34 32.5, δA = −40 22 08). |
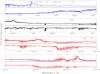 |
Fig. 2 Spectra of object A (upper panels) and object B (lower panels) obtained with X-shooter. Flat-field correction, bias and sky subtraction, and flux calibration were performed on both spectra. Vertical dotted lines highlight the main emission features which allow to identify object A as a QSO. Similar features are totally absent in the spectrum of object B. (Color legend – Blue: UVB arm; black: VIS arm; red: NIR arm.) |
2. Origin of the misidentification
We argue that the misidentification of object B as a QSO is a consequence of poorly-constrained measurements on the object A, which is in fact the only QSO in a radius of 10 arcmin. Different values of position and redshift attributed to A during the years were interpreted as the presence of two QSOs in this region, one of which was incorrectly identified with B.
QSO A was first observed by Hoag & Smith (1977) at B1950 coordinates α = 01 32 22.2, δ = −40 37 18. Osmer (1980) published the redshift of this objects, z = 2.15 ± 0.011. The QSO is included in the Automatic Plate Measurement (APM) galaxy survey (Maddox et al. 1990) and in the catalog by Hewitt & Burbidge (1993) (labeled as B 0132-406). It is also listed in the catalog by Iovino et al. (1996), with B1950 coordinates α = 01 32 21.2, δ = −40 37 29 and redshift z = 2.10. Despite the slight differences, there is no doubt that the object is the same.
Unfortunately, the finding chart published by Hoag & Smith (1977) points to object B, not to object A, as the target QSO. This error (together with the poor accuracy of the published QSO position) is the most probable cause of the misidentification, which can be traced back to Véron-Cetty & Véron (1996a). Here the B1950 coordinates of the QSO appear to be α = 01 32 21.12, δ = −40 36 53.7 (corresponding to J2000 coordinates α = 01 34 32.27, δ = −40 21 33.6), quite different than the values previously measured, and coincident with the position of object B. The new coordinates appear in all editions of the Véron-Cetty & Véron catalog until 2001 (Véron-Cetty & Véron 1996b, 1998, 2000, 2001). During this period, all references to Q 0132-4037 (Barkhouse & Hall 2001; Cutri et al. 2003) point to object B instead of object A.
The real QSO reappears in Véron-Cetty & Véron (2003) as an additional entry Q 01323-4037, distinct from Q 0132-4037. The authors cite Iovino et al. (1996) as a reference for the first one, and Osmer (1980) as a reference for the second one. The slight difference in position and redshift may have led them to believe there were two different QSO, even though both Osmer (1980) and Iovino et al. (1996) had observed the same object. The error has been reproduced in the subsequent of the catalog until today (Véron-Cetty & Véron 2006, 2010).
To summarize: the two entries Q 01323-4037 and Q 0132-4037 in the last editions of Véron-Cetty & Véron catalog correspond in fact to a single object, QSO A, with J2000 coordinates α = 01 34 32.5, δ = −40 22 08 and redshift z between 2.10 and 2.15. Object B, whose coordinates are associated with Q 0132-4037, is not a QSO and should not be considered as such. The spectrum of object B is that of a star with spectral type early M, as seen from weak (but clear) TiO absorption bands around 620 nm and 710 nm. The spectrum shows a good resemblance to the spectrum of the M1 III star (Bagnulo et al. 2003).
Hereafter, we suggest to address to object A as Q 0132-4037, and to stop using the ambiguous identifier Q 01323-4037 introduced by Véron-Cetty & Véron (2003).
3. Refined measurement of Q 0132-4037 redshift
According to several studies (Gaskell 1982; Vrtilek & Carleton 1985; Hutchings et al. 1987), redshift estimated from forbidden lines are in agreement to ~100 km s-1 with the systemic redshifts of QSOs as determined by stellar absorption and H i 21 cm emission in the host galaxies. We estimated the redshift of Q 0132-4037 by a Gaussian fitting of the narrow line [O iii] λ5007, which appears unblended and quite prominent in the NIR part of the spectrum (Fig. 2). We obtained z [Oiii] = 2.1568 ± 0.0081. The same procedure was performed for the low-ionization line Mg ii λ2798 and the Hβ line, giving zMgii = 2.1614 ± 0.0155 and zHβ = 2.1629 ± 0.0200, respectively. The three estimates are in agreement within the uncertainty. The combined fiducial value of the systemic redshift is estimated as zsys = 2.1583 ± 0.0067, confirming the value by Osmer (1980) and ruling out the value z = 2.10 published by Iovino et al. (1996).
Quite interestingly, Hoag & Smith (1977) and Osmer (1980) are quoted in the NASA-IPAC Extragalactic Database as references for A, and in the SIMBAD Astronomical Database as references for B. This is a hint that some mismatch occurred in the identification of the two objects.
Acknowledgments
Based on observations collected at the European Southern Observatory, Chile, as part of program 086.A-0076. The Dark Cosmology Centre is funded by the Danish National Research Foundation. G. C. would like to thank Carlo Morossi for his help in recognizing the spectral type of object B.
References
- Bagnulo, S., Jehin, E., Ledoux, C., et al. 2003, ESO Messenger, 114, 10 [Google Scholar]
- Barkhouse, W. A., & Hall, P. B. 2001, AJ, 121, 2843 [NASA ADS] [CrossRef] [Google Scholar]
- Cutri, R. M., Skrutskie, M. F., Dyk, S. V., et al. 2003, The IRSA 2MASS All-Sky Point Source Catalog [Google Scholar]
- D’Odorico, S., Dekker, H., Mazzoleni, R., et al. 2006, SPIE, 6269, 98 [Google Scholar]
- Gaskell, C. M. 1982, ApJ, 263, 79 [NASA ADS] [CrossRef] [Google Scholar]
- Goldoni, P., Royer, F., François, P., et al. 2006, SPIE, 6269, 80 [Google Scholar]
- Hewitt, A., & Burbidge, G. 1993, ApJS, 87, 451 [NASA ADS] [CrossRef] [Google Scholar]
- Hoag, A. A., & Smith, M. G. 1977, ApJ, 217, 362 [NASA ADS] [CrossRef] [Google Scholar]
- Hutchings, J. B., Gower, A. C., & Price, R. 1987, AJ, 93, 6 [NASA ADS] [CrossRef] [Google Scholar]
- Iovino, A., Clowes, R., & Shaver, P. 1996, A&AS, 119, 265 [NASA ADS] [CrossRef] [EDP Sciences] [Google Scholar]
- Maddox, S. J., Efstathiou, G., Sutherland, W. J., & Loveday, J. 1990, MNRAS, 243, 692 [NASA ADS] [Google Scholar]
- Osmer, P. S. 1980, ApJS, 42, 523 [NASA ADS] [CrossRef] [Google Scholar]
- Véron-Cetty, M.-P., & Véron, P. 1996a, A&AS, 115, 97 [Google Scholar]
- Véron-Cetty, M.-P., & Véron, P. 1996b, ESO Scientific Report [Google Scholar]
- Véron-Cetty, M.-P., & Véron, P. 1998, ESO Scientific Report [Google Scholar]
- Véron-Cetty, M.-P., & Véron, P. 2000, ESO Scientific Report [Google Scholar]
- Véron-Cetty, M.-P., & Véron, P. 2001, A&A, 374, 92 [NASA ADS] [CrossRef] [EDP Sciences] [Google Scholar]
- Véron-Cetty, M.-P., & Véron, P. 2003, A&A, 412, 399 [NASA ADS] [CrossRef] [EDP Sciences] [Google Scholar]
- Véron-Cetty, M.-P., & Véron, P. 2006, A&A, 455, 773 [NASA ADS] [CrossRef] [EDP Sciences] [Google Scholar]
- Véron-Cetty, M.-P., & Véron, P. 2010, A&A, 518, 10 [Google Scholar]
- Vrtilek, J. M., & Carleton, N. P. 1985, ApJ, 294, 106 [NASA ADS] [CrossRef] [Google Scholar]
All Figures
|
Fig. 1 Finding chart with the position of object A (a QSO) and object B (a star mistakenly identified as a separate QSO). The image is centered on object A (J2000 coordinates αA = 01 34 32.5, δA = −40 22 08). |
| In the text | |
|
Fig. 2 Spectra of object A (upper panels) and object B (lower panels) obtained with X-shooter. Flat-field correction, bias and sky subtraction, and flux calibration were performed on both spectra. Vertical dotted lines highlight the main emission features which allow to identify object A as a QSO. Similar features are totally absent in the spectrum of object B. (Color legend – Blue: UVB arm; black: VIS arm; red: NIR arm.) |
| In the text | |
Current usage metrics show cumulative count of Article Views (full-text article views including HTML views, PDF and ePub downloads, according to the available data) and Abstracts Views on Vision4Press platform.
Data correspond to usage on the plateform after 2015. The current usage metrics is available 48-96 hours after online publication and is updated daily on week days.
Initial download of the metrics may take a while.