Fig. 3
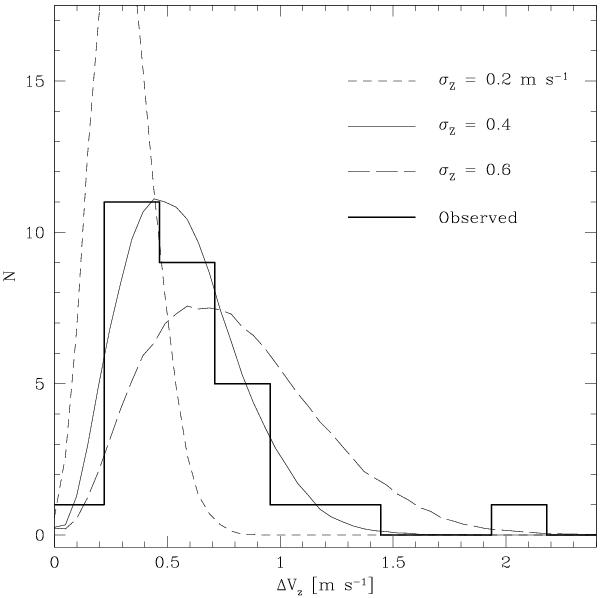
Distribution of observed Zeeman splitting (thick solid line) in the Effelsberg 6.7 GHz methanol maser sample. Over-plotted are models for the line of sight Zeeman splitting in the case of where the magnetic field is taken to have a Gaussian distribution with a Zeeman splitting dispersion of σZ in each dimension. Following a simple analysis, the best fitted model has σZ = 0.4 m s-1 which would corresponds to a full 3-dimensional equivalent Zeeman splitting of ⟨ ΔVz ⟩ ≈ 0.62 m s-1. As an indication, using the uncertain laboratory extrapolated g-factor (Sect. 3) this corresponds to ⟨ |B| ⟩ ≈ 120 mG.
Current usage metrics show cumulative count of Article Views (full-text article views including HTML views, PDF and ePub downloads, according to the available data) and Abstracts Views on Vision4Press platform.
Data correspond to usage on the plateform after 2015. The current usage metrics is available 48-96 hours after online publication and is updated daily on week days.
Initial download of the metrics may take a while.