Fig. B.1
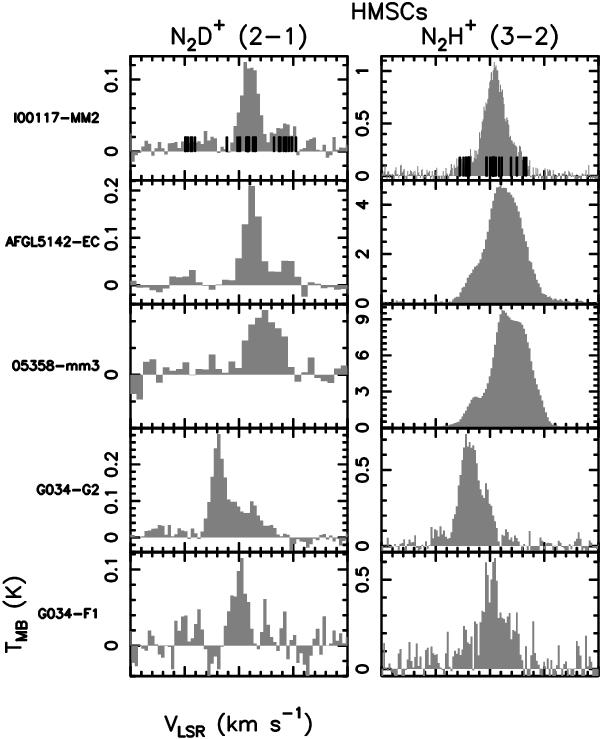
Spectra of N2D+ (2–1) and N2H+ (3–2) obtained towards the sources classified as HMSCs. For each spectrum, the velocity interval shown is ± 10 km s-1 from the systemic velocity listed in Table A.1. The y-axis is in main beam brightness temperature units. In the spectra of I00117-MM2, the vertical bars show the position of the hyperfine components.
Current usage metrics show cumulative count of Article Views (full-text article views including HTML views, PDF and ePub downloads, according to the available data) and Abstracts Views on Vision4Press platform.
Data correspond to usage on the plateform after 2015. The current usage metrics is available 48-96 hours after online publication and is updated daily on week days.
Initial download of the metrics may take a while.