Fig. 7
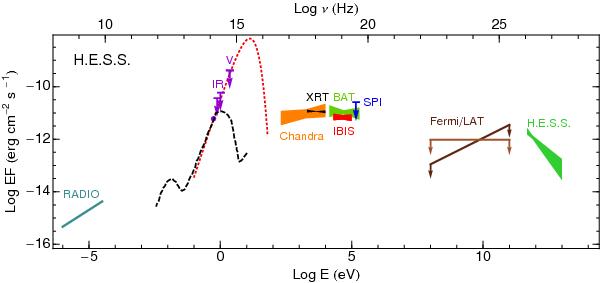
Spectral energy distribution of the sources discussed in Sect. 3. The details of the data and sources used in this plot are given in Table 1 and in Sect. 3.2. The dashed black line is the spectral template of elliptical galaxies from Silva et al. (1998) at a distance of 570 Mpc. The dotted (red) line is the blackbody spectrum of a massive star with parameters identical with the companion star in the gamma-ray binary LS 5039 at a distance of 25 kpc. The data in IR (2MASS) and visual (Swift/UVOT) bands were corrected for extinction. For Fermi/LAT we plot both upper limits for Γ = 1.5 (dark brown) and Γ = 2.0 (light brown).
Current usage metrics show cumulative count of Article Views (full-text article views including HTML views, PDF and ePub downloads, according to the available data) and Abstracts Views on Vision4Press platform.
Data correspond to usage on the plateform after 2015. The current usage metrics is available 48-96 hours after online publication and is updated daily on week days.
Initial download of the metrics may take a while.