Free Access
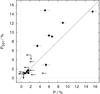
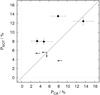
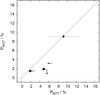
Fig. 6
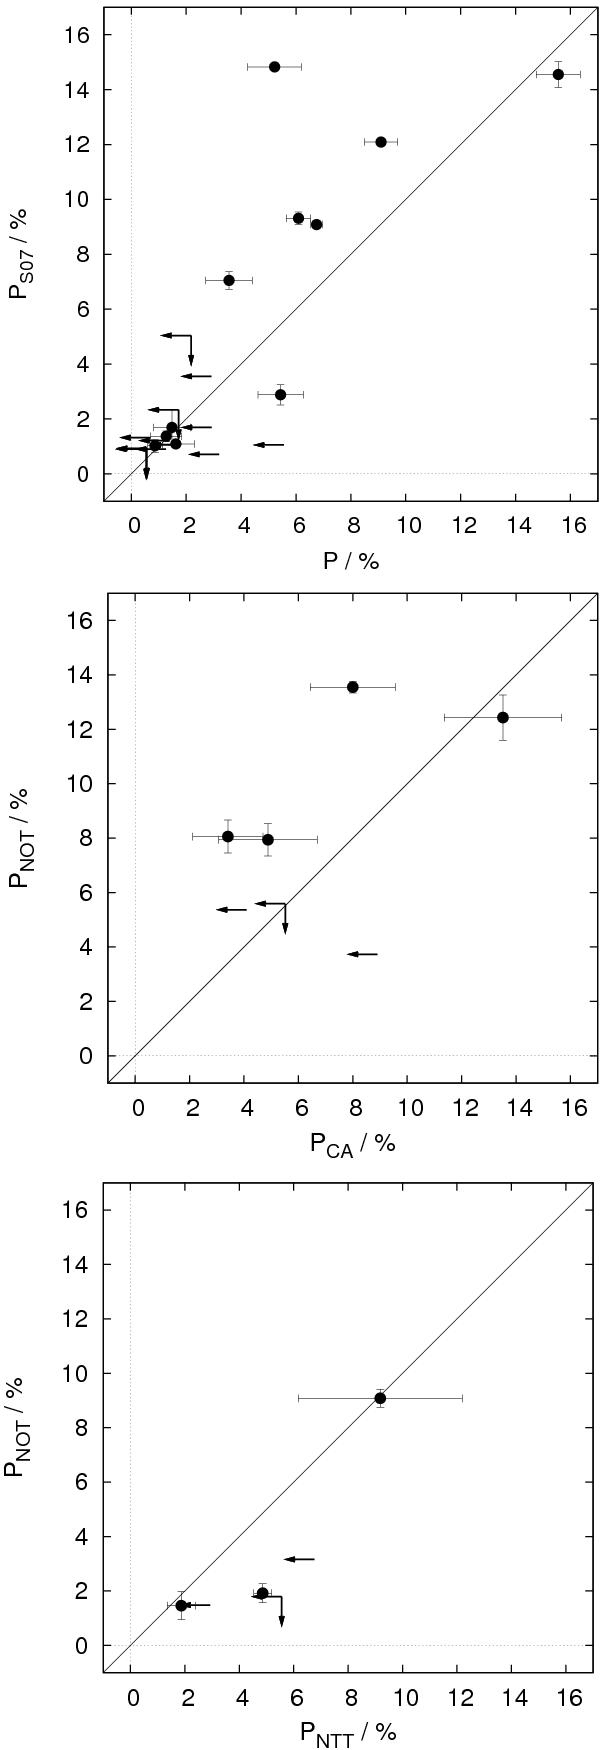
Polarization measurements of S07 compared to ours (top), NOT vs. CA (center) and NOT vs. NTT (bottom). The diagonal line gives the 1:1 correspondence. The arrows indicate upper limits. Polarization variability for a number of objects is apparent in particular at larger baselines.
This figure is made of several images, please see below:
Current usage metrics show cumulative count of Article Views (full-text article views including HTML views, PDF and ePub downloads, according to the available data) and Abstracts Views on Vision4Press platform.
Data correspond to usage on the plateform after 2015. The current usage metrics is available 48-96 hours after online publication and is updated daily on week days.
Initial download of the metrics may take a while.