Fig. 5
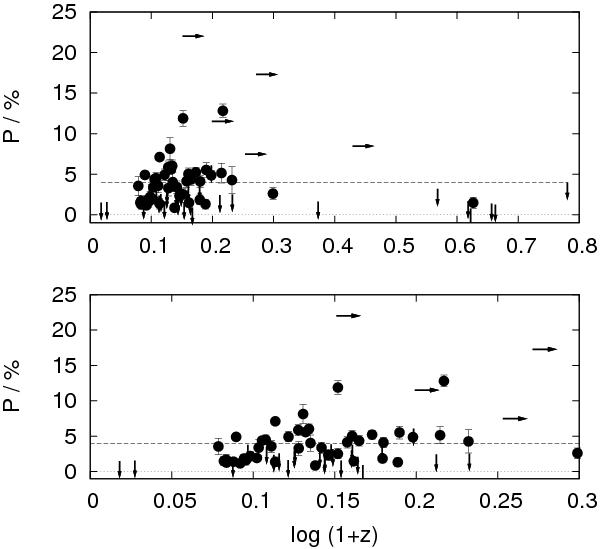
Polarization versus redshift of our targets with reliable redshifts (black dots), lower limits to the redshift (right arrows), and upper limits to the polarization (down arrows). The dashed line marks 4% polarization. The upper panel displays the results for the full data set, while the lower panel shows our results for redshifts up to z = 1 only.
Current usage metrics show cumulative count of Article Views (full-text article views including HTML views, PDF and ePub downloads, according to the available data) and Abstracts Views on Vision4Press platform.
Data correspond to usage on the plateform after 2015. The current usage metrics is available 48-96 hours after online publication and is updated daily on week days.
Initial download of the metrics may take a while.