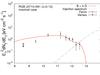
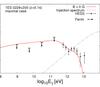
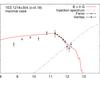
Fig. 5
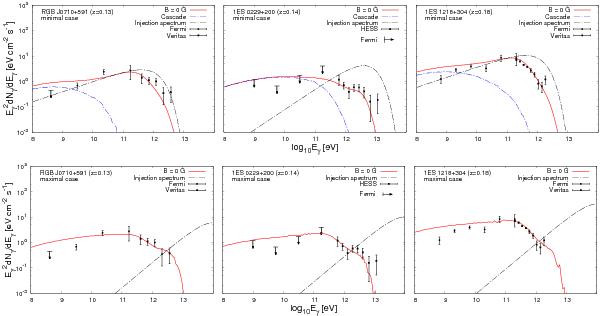
Top: the arriving photon energy flux, resulting from the “minimal cascade” model for RGB J0710+591 (left), 1ES 0229+200 (center) and 1ES 1218+304 (right). Fermi upper bounds are at the 99% confidence level. Notations are the same as in Fig. 4. Blue dash-dotted line shows the cascade component of the spectrum. Bottom: the results for the “maximal cascade” model.
Current usage metrics show cumulative count of Article Views (full-text article views including HTML views, PDF and ePub downloads, according to the available data) and Abstracts Views on Vision4Press platform.
Data correspond to usage on the plateform after 2015. The current usage metrics is available 48-96 hours after online publication and is updated daily on week days.
Initial download of the metrics may take a while.