Fig. 6
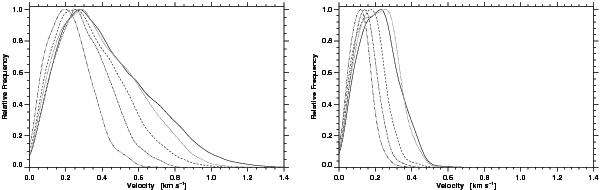
Relative frequency distributions of horizontal proper motions for quiet Sun (left) and G-band bright points (right) calculated over ΔT = 1 h (solid curve), 2 h (dotted curve), 4 h (dashed curve), 8 h (dash-dot-dotted curve), and 16 h (dash-triple dotted curve).
Current usage metrics show cumulative count of Article Views (full-text article views including HTML views, PDF and ePub downloads, according to the available data) and Abstracts Views on Vision4Press platform.
Data correspond to usage on the plateform after 2015. The current usage metrics is available 48-96 hours after online publication and is updated daily on week days.
Initial download of the metrics may take a while.