Fig. 5
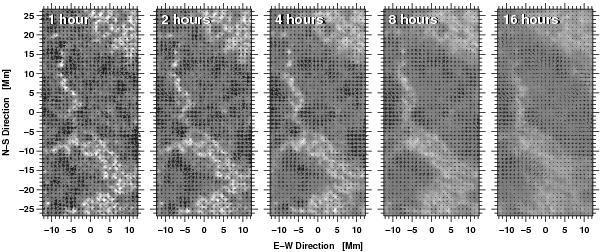
Time-averaged G-band images with horizontal flow vectors computed for ΔT = 1, 2, 4, 8, and 16 h. Arrows with a length corresponding to the grid spacing indicate velocities of 1 km s-1. The background images are displayed in the intensity range 0.5 ≤ I/I0 ≤ 1.5.
Current usage metrics show cumulative count of Article Views (full-text article views including HTML views, PDF and ePub downloads, according to the available data) and Abstracts Views on Vision4Press platform.
Data correspond to usage on the plateform after 2015. The current usage metrics is available 48-96 hours after online publication and is updated daily on week days.
Initial download of the metrics may take a while.