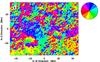
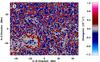
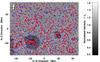
Fig. 2
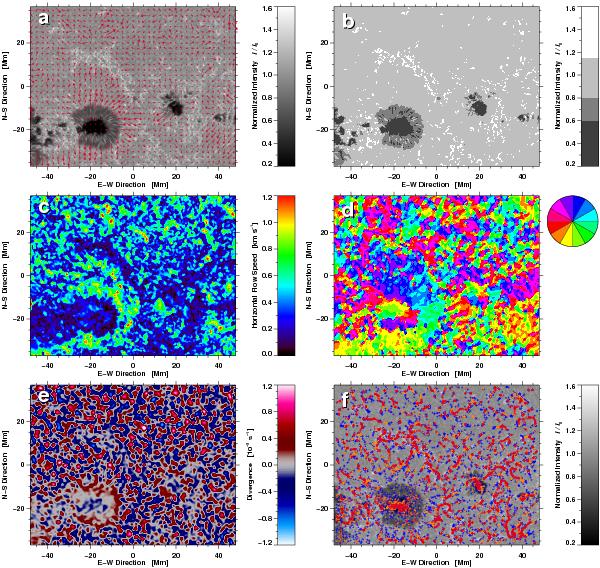
a) The average (60-min) G-band image after correction of geometrical foreshortening corresponding to the G-band image shown in Fig. 1a. The red arrows indicate the magnitude and direction of the horizontal proper motions. Arrows with a length corresponding to the grid size indicate velocities of 1 km s-1. b) Adaptive and fixed intensity thresholds are used to identify conglomerates of G-band bright points, granulation, penumbrae, umbrae, and pores. Color codes are used to point out c) flow speed and d) direction in high-resolution flow maps. The flow direction is encoded according to the 12 colors of the compass rose. Sources and sinks in a flow field can be identified in e) a divergence map. The f) forward cork maps provides additional means of visualizing converging motions. Test particles are subsequently superimposed on an average G-band image after they have followed the flows for two (blue), four (orange), and eight (red) hours. The conspicuous network of corks is related to the spatial scales of the meso-and supergranulation.
Current usage metrics show cumulative count of Article Views (full-text article views including HTML views, PDF and ePub downloads, according to the available data) and Abstracts Views on Vision4Press platform.
Data correspond to usage on the plateform after 2015. The current usage metrics is available 48-96 hours after online publication and is updated daily on week days.
Initial download of the metrics may take a while.