Fig. 1
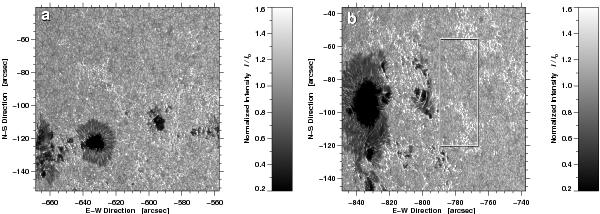
Calibrated G-band images of active regions a) NOAA 10960 and b) NOAA 10930 observed on 2007 June 4 and 2006 December 7, respectively. The FOV is 111″ × 111″. The annotation of the axes refers to heliocentric coordinates given in seconds of arc. The region in the rectangular white box is used for further analysis, zooming in on a quiet Sun region that contains numerous G-band bright points that outline the supergranular boundaries. The images were normalized in a way that the mode of the quiet Sun intensity distribution corresponds to unity.
Current usage metrics show cumulative count of Article Views (full-text article views including HTML views, PDF and ePub downloads, according to the available data) and Abstracts Views on Vision4Press platform.
Data correspond to usage on the plateform after 2015. The current usage metrics is available 48-96 hours after online publication and is updated daily on week days.
Initial download of the metrics may take a while.