Fig. 5
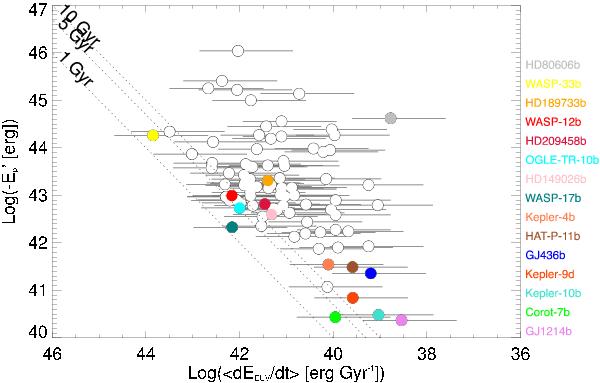
The “integrated” energy diagram for 98 transiting planets: the energy needed to escape the whole planet mass versus the X/EUV energy received per billion year. The dotted lines represent constant lifetimes of 1, 5, and 10 Gyr (from bottom to top). Data points are calculated with η = 0.15. Variations of η between 0.01 and 1 are represented as horizontal grey error bars.
Current usage metrics show cumulative count of Article Views (full-text article views including HTML views, PDF and ePub downloads, according to the available data) and Abstracts Views on Vision4Press platform.
Data correspond to usage on the plateform after 2015. The current usage metrics is available 48-96 hours after online publication and is updated daily on week days.
Initial download of the metrics may take a while.