Fig. 4
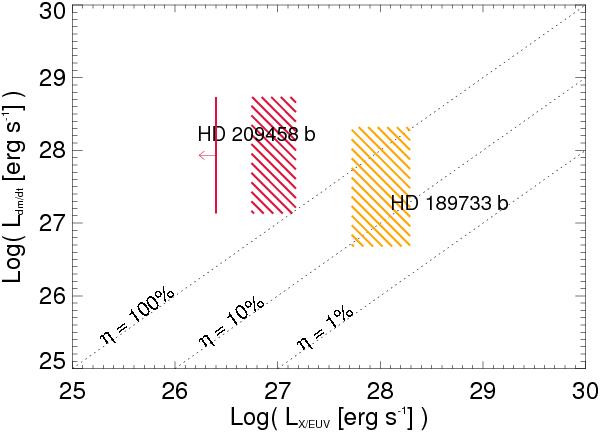
The power diagram for evaporating extrasolar planets. The “mass-loss power” Lṁ (Eq. (5)) is plotted as a function of the X/EUV luminosity. Constant η values are represented by the dotted lines. The hatched regions show the position of HD 189733b (orange) and HD 209458b (crimson). For HD 209458b, the right-pointing arrow shows the upper limit on the X/EUV luminosity reported by Sanz-Forcada et al. (2011).
Current usage metrics show cumulative count of Article Views (full-text article views including HTML views, PDF and ePub downloads, according to the available data) and Abstracts Views on Vision4Press platform.
Data correspond to usage on the plateform after 2015. The current usage metrics is available 48-96 hours after online publication and is updated daily on week days.
Initial download of the metrics may take a while.