Free Access
Fig. 3
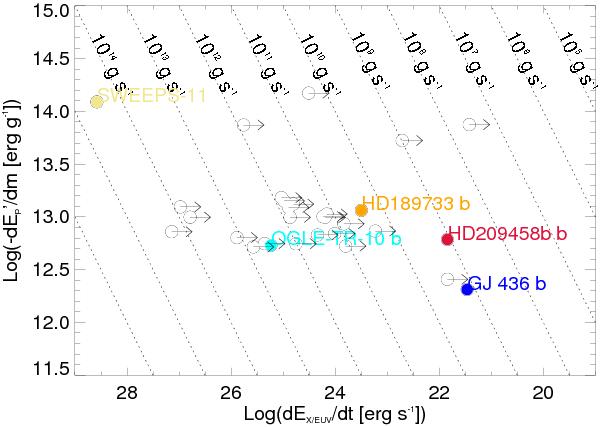
The energy diagram for 35 transiting planets with X-ray emission detections or upper limits (arrows) reported in the literature. Caption is the same as for Fig. 1. Data points are calculated with η = 15%. Planets of interest are outlined with different colours.
Current usage metrics show cumulative count of Article Views (full-text article views including HTML views, PDF and ePub downloads, according to the available data) and Abstracts Views on Vision4Press platform.
Data correspond to usage on the plateform after 2015. The current usage metrics is available 48-96 hours after online publication and is updated daily on week days.
Initial download of the metrics may take a while.