Free Access
Fig. 2
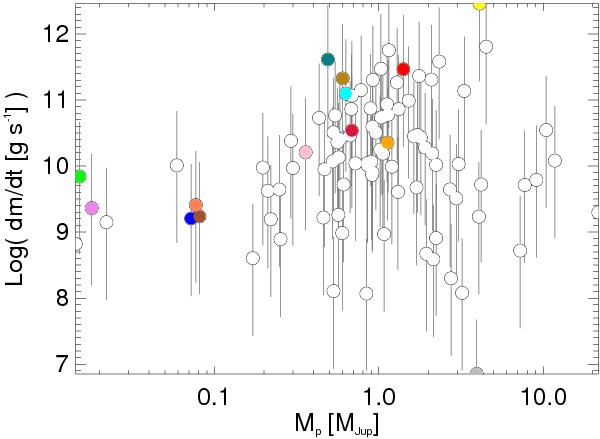
Mass-loss rate (η = 0.15) as a function of the planet mass for 98 transiting planets. The vertical error bars represent a variation of η from 0.01 (lower values) to 1 (higher values). Planets of interest are coloured accordingly to Fig. 1.
Current usage metrics show cumulative count of Article Views (full-text article views including HTML views, PDF and ePub downloads, according to the available data) and Abstracts Views on Vision4Press platform.
Data correspond to usage on the plateform after 2015. The current usage metrics is available 48-96 hours after online publication and is updated daily on week days.
Initial download of the metrics may take a while.