Fig. 1
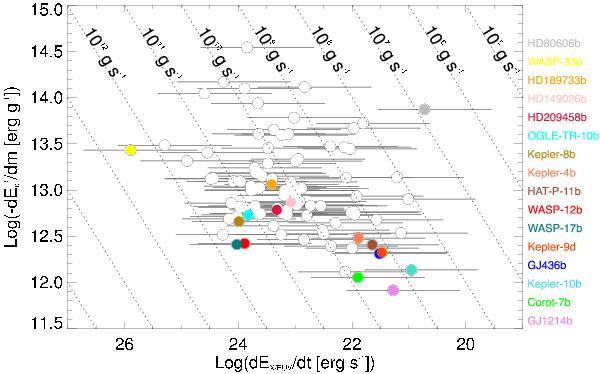
The energy diagram for 98 transiting planets: the energy needed to escape a unit of mass of the planet atmosphere versus the X/EUV flux reaching the top of the atmosphere per unit of time. The dotted lines indicate constant mass loss rates of ṁ = 1015 to 105 g s-1 (from left to right). Data points are calculated with η = 15%. Variations of η between 1% and 100% are represented with horizontal grey error bars. Coloured points and labels indicate transiting planets of particular interest, which are discussed in the text.
Current usage metrics show cumulative count of Article Views (full-text article views including HTML views, PDF and ePub downloads, according to the available data) and Abstracts Views on Vision4Press platform.
Data correspond to usage on the plateform after 2015. The current usage metrics is available 48-96 hours after online publication and is updated daily on week days.
Initial download of the metrics may take a while.