Fig. 9
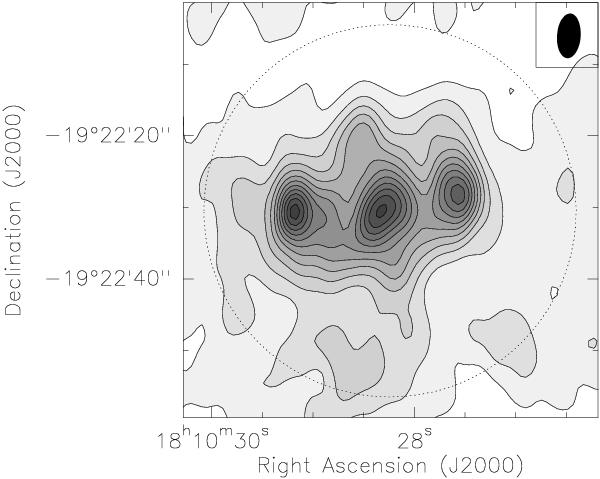
CH3OH 2k → 1kvt = 0 integrated intensity map combining PdBI and 30 m data. The emission is integrated over the 2-1 → 1-1E, 20 → 10A, and 20 → 10E transitions. First contour and contour spacing are 0.39 Jy beam-1 km s-1 (3σ), the dashed contours show the negative emission (− 3σ). The synthesized beam (6 2 × 33; PA = 176°) is shown in the upper right corner. The dotted circle indicates the interferometer primary beam (52″).
Current usage metrics show cumulative count of Article Views (full-text article views including HTML views, PDF and ePub downloads, according to the available data) and Abstracts Views on Vision4Press platform.
Data correspond to usage on the plateform after 2015. The current usage metrics is available 48-96 hours after online publication and is updated daily on week days.
Initial download of the metrics may take a while.