Fig. 8
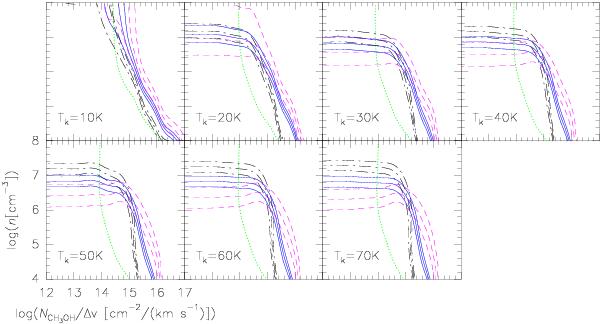
Results of statistical equilibrium calculations for CH3OH-E. Observed integrated intensity line ratios are color-coded as in Fig. 7 and plotted on a logarithmic scale (along with their 1σ values) as a function of H2 density and NCH3OH/ΔV at different temperatures (10−70 K). The green dotted line represents the peak main brightness temperature of the 50 → 40E transition.
Current usage metrics show cumulative count of Article Views (full-text article views including HTML views, PDF and ePub downloads, according to the available data) and Abstracts Views on Vision4Press platform.
Data correspond to usage on the plateform after 2015. The current usage metrics is available 48-96 hours after online publication and is updated daily on week days.
Initial download of the metrics may take a while.