Fig. 7
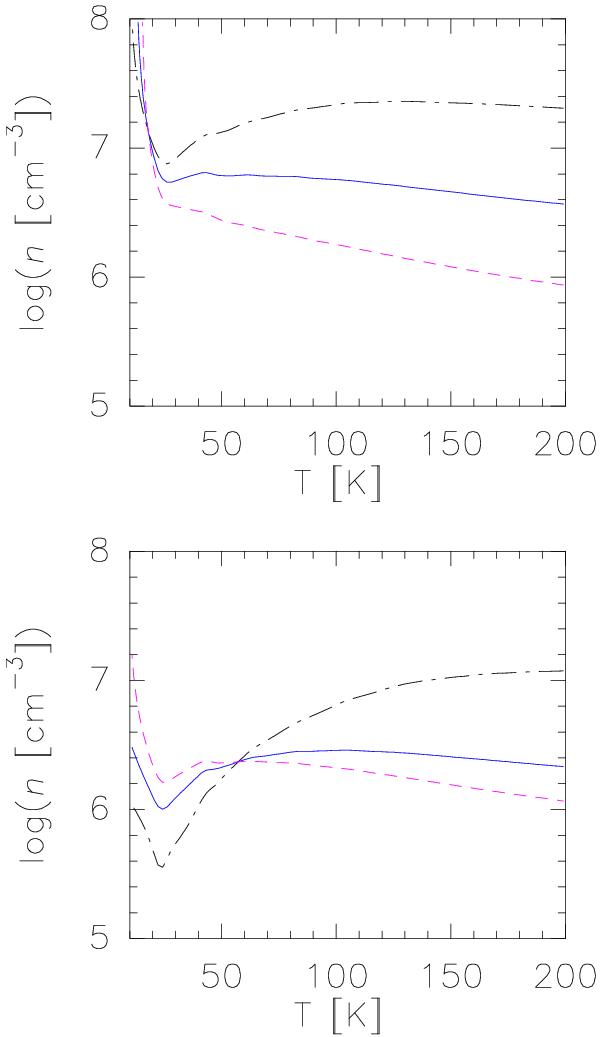
Results of statistical equilibrium calculations for CH3OH-E. The 50 → 40/5-1 → 4-1 (black dash-dotted line), 51 → 41/5-1 → 4-1 (blue solid line), and 51 → 41/50 → 40 (pink dashed line) observed integrated intensity line ratios toward the (1 5, 0″) position on a logarithmic scale are shown as function of H2 density and temperature at NCH3OH/ΔV = 1014 cm-2/(km s-1) (top) and NCH3OH/ΔV = 1015 cm-2/(km s-1) (bottom).
Current usage metrics show cumulative count of Article Views (full-text article views including HTML views, PDF and ePub downloads, according to the available data) and Abstracts Views on Vision4Press platform.
Data correspond to usage on the plateform after 2015. The current usage metrics is available 48-96 hours after online publication and is updated daily on week days.
Initial download of the metrics may take a while.