Fig. 5
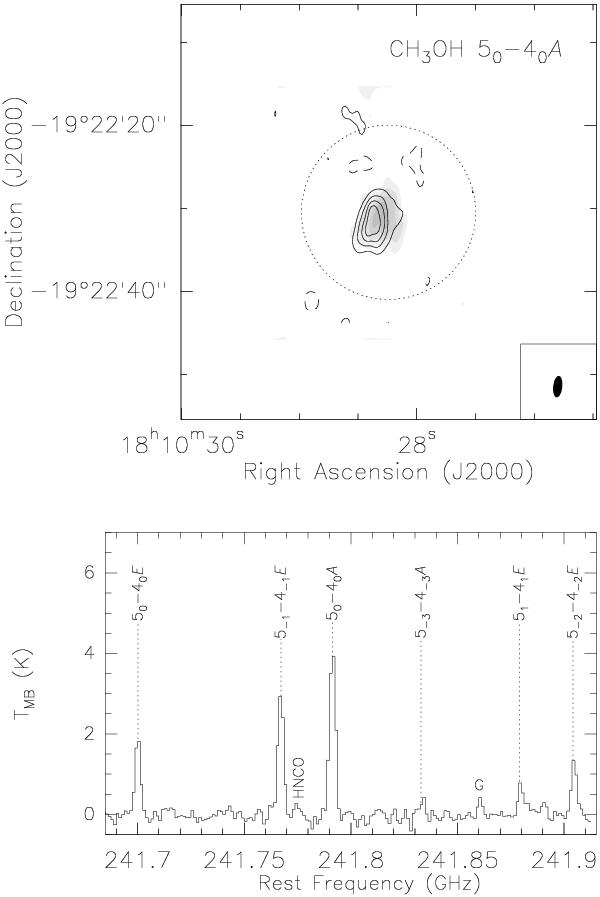
Top: contour image of the emission integrated under the 50 → 40A transition line, overlaid on the greyscale 1.2 mm continuum emission of G11.11P1. First contour and contour spacing are 0.16 Jy beam-1 km s-1 (3σ); the dashed contours show the negative emission (− 3σ). The synthesized beam (2 6 × 11; PA = 174°) is shown in the lower right corner. The dotted circle indicates the interferometer primary beam (21″) at this frequency. Bottom: spectrum of CH3OH 5k → 4k toward the position: RA = 18h10m28
 40, Dec = −19°22′319 (J2000). The HNCO 110,11 → 100,10 line (at 241 774.0320 MHz with Eu/k = 69.67 K and μ2S = 27.4590 D2) is shown as well. The “G” shows an artifact produced in the central channels of a correlator unit by the Gibbs effect.
Current usage metrics show cumulative count of Article Views (full-text article views including HTML views, PDF and ePub downloads, according to the available data) and Abstracts Views on Vision4Press platform.
Data correspond to usage on the plateform after 2015. The current usage metrics is available 48-96 hours after online publication and is updated daily on week days.
Initial download of the metrics may take a while.