Fig. 4
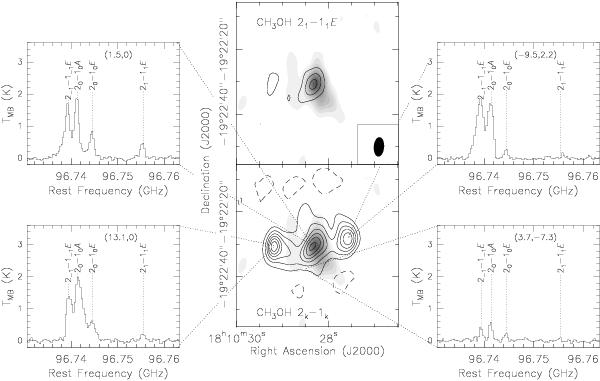
In greyscale, the 3.1 mm continuum emission of G11.11P1. Top middle: contour image of the CH3OH emission integrated under the line 21 → 11E. First contour and contour spacing are 0.66 Jy beam-1 km s-1 (3σ). The synthesized beam (6 0 × 32; PA = 174°) is shown in the lower right corner. Bottom middle: contour image of the CH3OH emission integrated under the 2-1 → 1-1E, 20 → 10A, and 20 → 10E transition lines. First contour and contour spacing are 0.45 Jy beam-1 km s-1 (3σ). The dashed contours show the negative emission (− 3σ). We also show spectra at four different positions; positions are given in each inset in parenthesis in units of arcsec.
Current usage metrics show cumulative count of Article Views (full-text article views including HTML views, PDF and ePub downloads, according to the available data) and Abstracts Views on Vision4Press platform.
Data correspond to usage on the plateform after 2015. The current usage metrics is available 48-96 hours after online publication and is updated daily on week days.
Initial download of the metrics may take a while.