Fig. 3
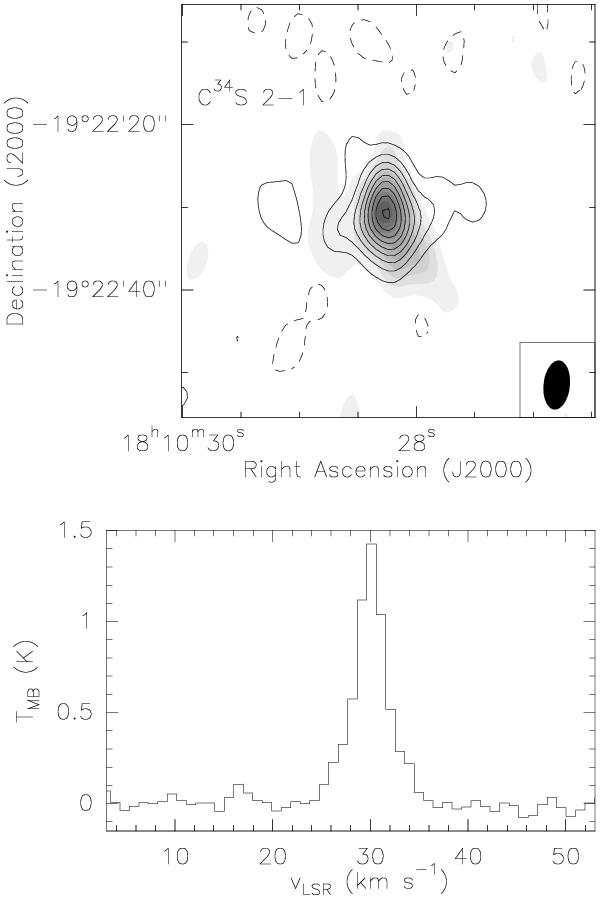
Top: contour image of the emission integrated under the C34S 2 → 1 line, in the velocity range from 22.4 to 37.9 km s-1, overlaid on the grey-scale 3.1 mm continuum emission of G11.11P1. First contour and contour spacing are 0.09 Jy beam-1 km s-1 (3σ), the dashed contours show the negative emission (− 3σ). The synthesized beam (6 0 × 32; PA = 176°) is shown in the lower right corner. Bottom: spectrum of C34S 2 → 1 toward the peak position on the integrated intensity map at RA = 18h10m28
 24, Dec = −19°22′305 (J2000).
Current usage metrics show cumulative count of Article Views (full-text article views including HTML views, PDF and ePub downloads, according to the available data) and Abstracts Views on Vision4Press platform.
Data correspond to usage on the plateform after 2015. The current usage metrics is available 48-96 hours after online publication and is updated daily on week days.
Initial download of the metrics may take a while.