Fig. 2
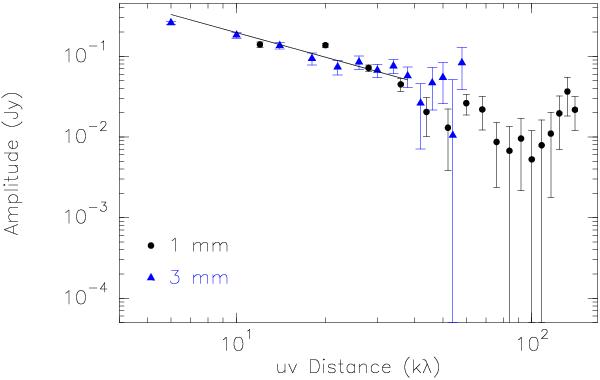
Continuum emission from G11.11P1 at 3.1 mm (filled triangles) and 1.2 mm (filled circles) in the Fourier domain. Amplitudes are averaged in bins of deprojected u-v distance from the continuum intensity peaks. The 3.1 mm u-v amplitudes have been scaled by a factor of 15. The straight solid line represents the least squares fit to the data. Error bars represent 1σ statistical errors based on the standard deviation in the mean of the data points in the bin.
Current usage metrics show cumulative count of Article Views (full-text article views including HTML views, PDF and ePub downloads, according to the available data) and Abstracts Views on Vision4Press platform.
Data correspond to usage on the plateform after 2015. The current usage metrics is available 48-96 hours after online publication and is updated daily on week days.
Initial download of the metrics may take a while.