Fig. 10
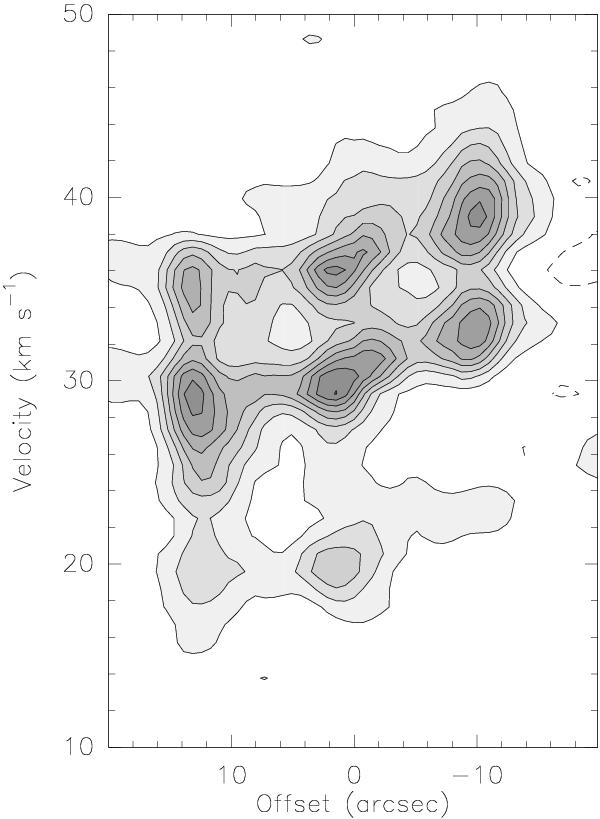
Position-velocity plot of the methanol 2k → 1k lines, cutting along the PA = 96° on the map shown in the middle bottom panel of Fig. 4. We show the transitions: 2-1 → 1-1E, 20 → 10A, and 21 → 11E. The offset is measured in a positive direction toward east and from the pointing center of the observations. First contour is 0.018 in steps of 0.036 Jy beam-1, the dashed contours show the negative emission (− 0.018 Jy beam-1).
Current usage metrics show cumulative count of Article Views (full-text article views including HTML views, PDF and ePub downloads, according to the available data) and Abstracts Views on Vision4Press platform.
Data correspond to usage on the plateform after 2015. The current usage metrics is available 48-96 hours after online publication and is updated daily on week days.
Initial download of the metrics may take a while.