Fig. 1
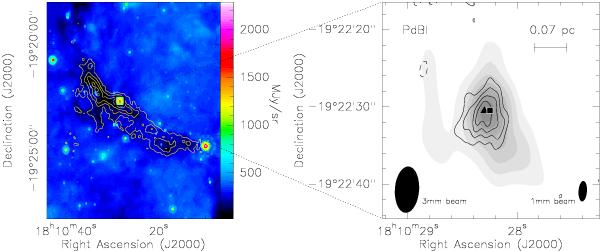
Left: SCUBA 850 μm (Carey et al. 2000) contours overlaid on the MIPSGAL 24 μm image of the IRDC G11.11-0.12. Right: PdBI 1.2 mm continuum emission (contours) of G11.11P1 overlaid on the 3.1 mm continuum emission (grey scale image). First contour and contour spacing for the 3.1 mm emission are 0.9 mJy beam-1 (3σ), the dotted contours show the negative emission (− 3σ); the synthesized beam (6 0 × 31; PA = 176°) is shown in the bottom left corner. First contour and contour spacing for the 1.2 mm emission are 6.3 mJy beam-1 (3σ), the dashed contours show the negative emission (− 3σ); the synthesized beam (26 × 11; PA = 176°) is shown in the bottom right corner. The filled triangle at RA = 18h10m28
 29, Dec = −19°22′305 and the filled square at RA = 18h10m2825, Dec = −19°22′3045 (J2000) indicate the water and (integrated emission) methanol masers, respectively, reported by Pillai et al. (2006b).
Current usage metrics show cumulative count of Article Views (full-text article views including HTML views, PDF and ePub downloads, according to the available data) and Abstracts Views on Vision4Press platform.
Data correspond to usage on the plateform after 2015. The current usage metrics is available 48-96 hours after online publication and is updated daily on week days.
Initial download of the metrics may take a while.