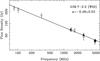
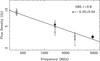
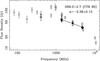
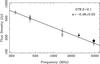
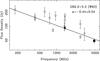
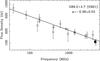
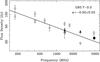
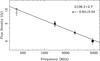
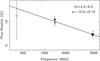
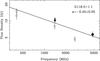
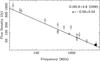
Fig. 2
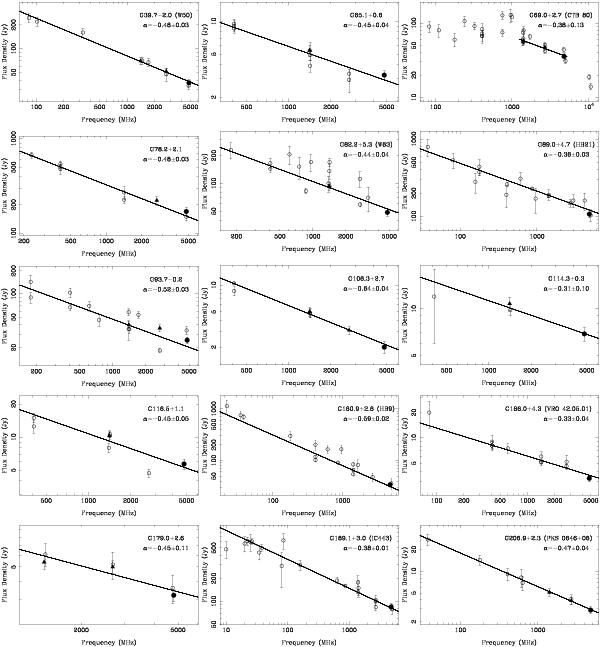
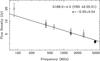
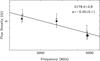
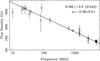
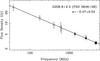
Flux densities at various frequencies were used to derive the integrated radio spectra for 15 SNRs (not including G205.5+0.5). The black dots indicate the newly derived flux density at λ6 cm from the Urumqi observations, and the triangles for the newly derived flux densities from the Effelsberg λ11 cm and λ21 cm surveys. The open circles are integrated flux densities taken from literature (see references in Table 1).
Current usage metrics show cumulative count of Article Views (full-text article views including HTML views, PDF and ePub downloads, according to the available data) and Abstracts Views on Vision4Press platform.
Data correspond to usage on the plateform after 2015. The current usage metrics is available 48-96 hours after online publication and is updated daily on week days.
Initial download of the metrics may take a while.